The 2012 Lockout
The season that almost wasn’t.
113 days of labor war. 510 games erased. A 48-game sprint from January to April.
The 2012–13 NHL lockout, and what the shot data shows.
What Happened
At 11:59 p.m. on September 15, 2012, the NHL’s collective bargaining agreement expired — and the owners locked out the players. It was the third lockout under commissioner Gary Bettman, and the fight was over the same fault line as always: money. Players had been taking roughly 57% of hockey-related revenue — a pool worth about $3.3 billion a year — while owners pushed for a 50–50 divide and a tighter salary cap.
The season was supposed to open on October 11. Instead, the calendar melted away. Preseason games canceled first, then regular-season games in waves, then the Winter Classic — the league’s outdoor showcase — and the All-Star Weekend. In total, 510 regular-season games never happened: 41.5% of the schedule.
Talks sputtered, broke down over the winter holiday, and nearly ended in court when the union considered disclaiming interest. Then, after a 16-hour bargaining session brokered by federal mediator Scot Beckenbaugh, a tentative deal landed at 4:45 a.m. on January 6, 2013 — 113 days after the lockout began. The new CBA split revenue 50–50, limited contract lengths, and was ratified within the week.
48
Games Per Team (vs. 82)
510
Games Never Played
5.30
Goals per Game — Unchanged from 5.30
The Sprint
The deal resurrected a 48-game season that ran from January 19 to April 28, 2013 — 99 days, roughly a game every other day. With no time to waste, the league scrapped all inter-conference games to cut travel and packed the schedule with back-to-backs after a one-week training camp.
The compressed chaos suited Chicago. The Blackhawks opened the season with 24 consecutive games without a regulation loss — an NHL record — and went on to win the Cup in June. The rest of the league simply tried to survive the treadmill.
By the Numbers
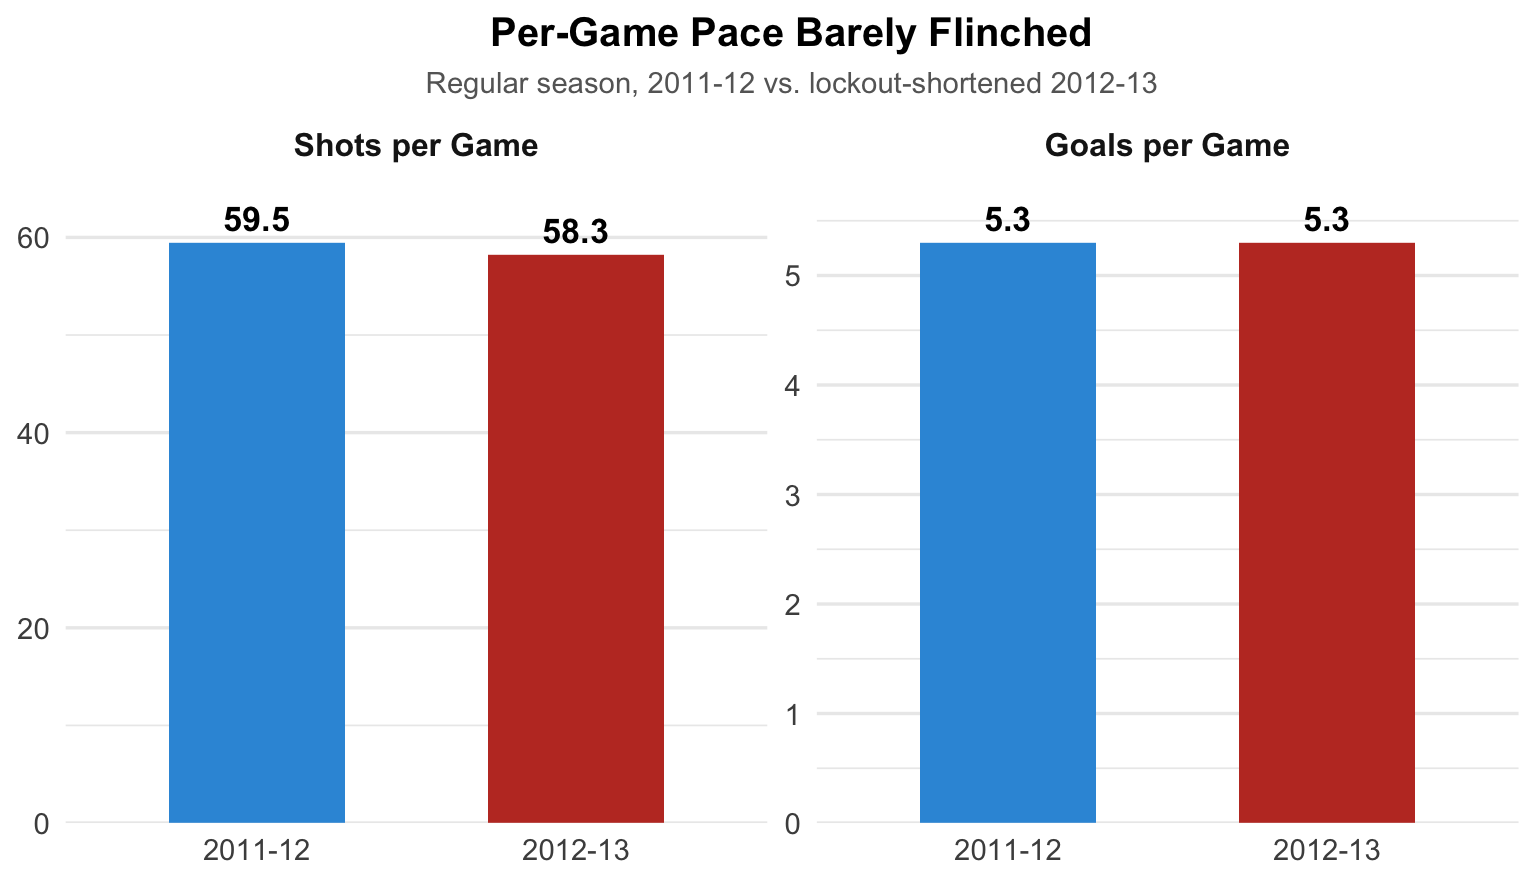
What did half a season do to the way the game was played? Almost nothing, at least per game. The shortened season produced 58.3 shots per game versus 59.5 the year before — a 2% dip — and scoring was essentially frozen at 5.30 goals per game in both seasons.
The lockout cut the quantity of hockey, not its character. Rate stats — the ones that describe how a game actually looks — shrugged off the disruption entirely.
Pace Held, Volume Vanished
Shot and goal rates per game, computed from the MoneyPuck shot data.
The Deepest Dip in 19 Seasons
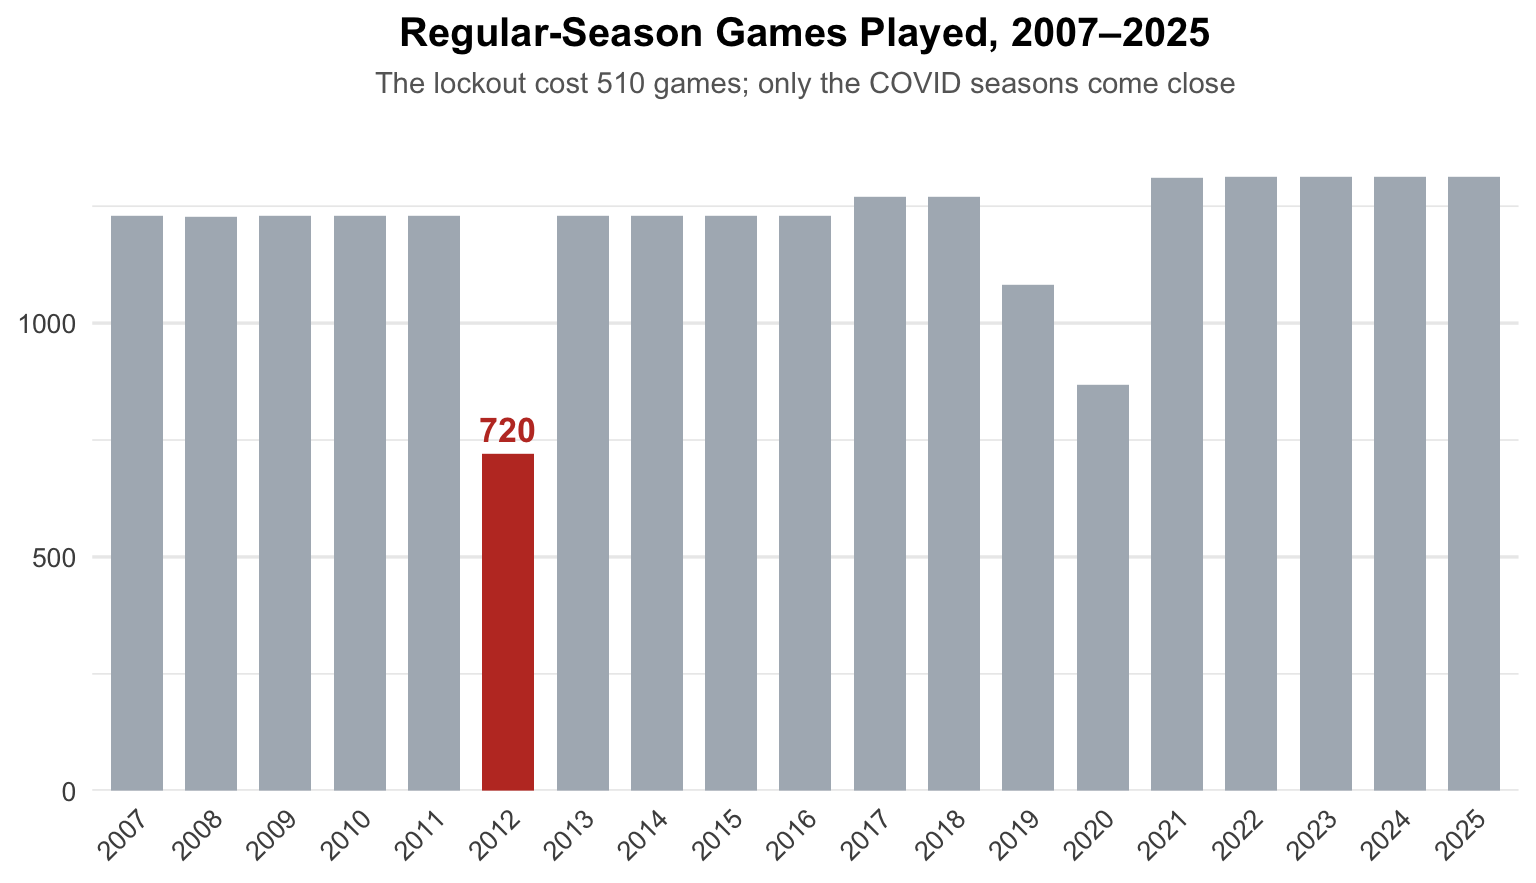
Regular-season games per season from the shot data. The 2019-20 and 2020-21 dips are COVID-shortened seasons. Compare seasons interactively →
The Takeaway
- The calendar shrank; the game didn’t. Shot and goal rates per game were nearly identical on either side of the lockout.
- Half the sample. Any comparison involving 2012-13 rests on 720 games instead of 1,230 — read raw totals carefully.
- Only a pandemic matched it. Across 19 seasons, only the COVID interruptions produced a comparable hole in the schedule.
The ice didn’t change when the lawyers left the room. Hockey, it turns out, is remarkably resistant to interruptions — as long as there are still games to play.
See it for yourself.
Head to the Exploration page and select season 2012 to explore the shortened year.