Every game, hundreds of pucks fly toward the net.
But only some of them come from dangerous places.
A data story across 19 NHL seasons.
The Question
Since 2007, over 2 million shot attempts have been fired across the NHL. Some found the back of the net. Most didn’t. The data doesn’t lie — it maps out exactly where offense lives on the ice, and where it dies.
Where do the goals actually come from?
2M+
Total Shots
~140K
Goals Scored
19
Seasons Analyzed
Act I: The Big Picture
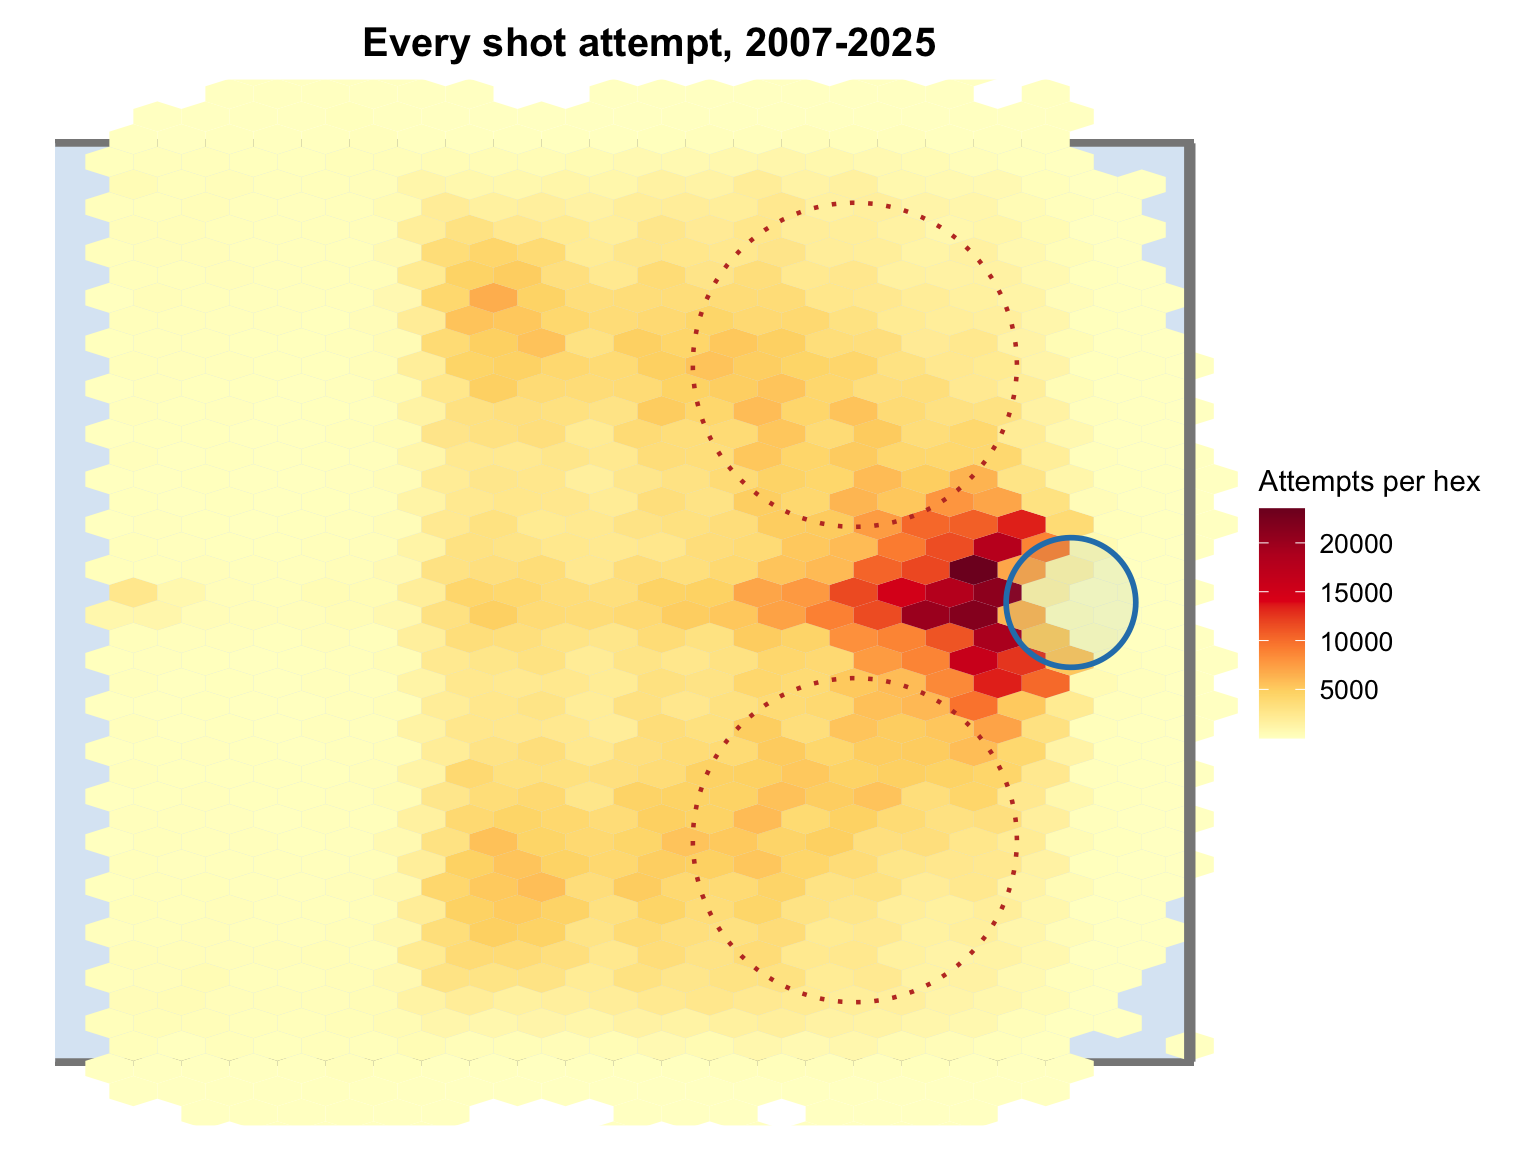
Zoom out. Every shot from every season, folded onto a single attacking end and overlaid on one rink. The bright spots reveal the hot zones — the areas where offense concentrates.
The glow is brightest between the faceoff circles, just above the goal line. This is the slot — the most dangerous real estate in hockey. The closer you are to the net, the more likely you are to score.
But not all players operate in the same neighborhoods.
All 2.08 million shot attempts (shots, misses, and goals) from 19 seasons, folded onto a single attacking end. Brightest hexes sit in the slot, between the faceoff circles and above the goal line.
Act II: The Cast of Characters
Every position has its own shooting identity — but the real divide runs between forwards and defensemen.
Centers own the slot. They lurk in the high-traffic corridor right in front of the net, reading the play, waiting for the pass, and pouncing on loose pucks. About half of every center’s attempts come from inside the slot, and their heatmap is a concentrated glow right in the heart of the offensive zone.
Left Wings and Right Wings play the same game. Strip the names off the panels and their heatmaps are nearly indistinguishable from the centers’: the same neighborhoods, the same 30-foot average, the same 8% scoring rate. Mirror one wing’s map onto the other and they line up — there is no left side or right side of the ice here, just forwards camping on the same dangerous ground.
Defensemen shoot from everywhere — but especially from the point, near the blue line. Their job isn’t always to score. It’s to get pucks through traffic, create rebounds, and keep plays alive. Their shots come from about 20 feet farther out — nearly 50 feet on average — from wider angles, from places where goals are rare but chaos is abundant. They score on barely 3.5% of their attempts.
Every position plays a different game, but only two games are being played. The ice is not one story — it’s two.
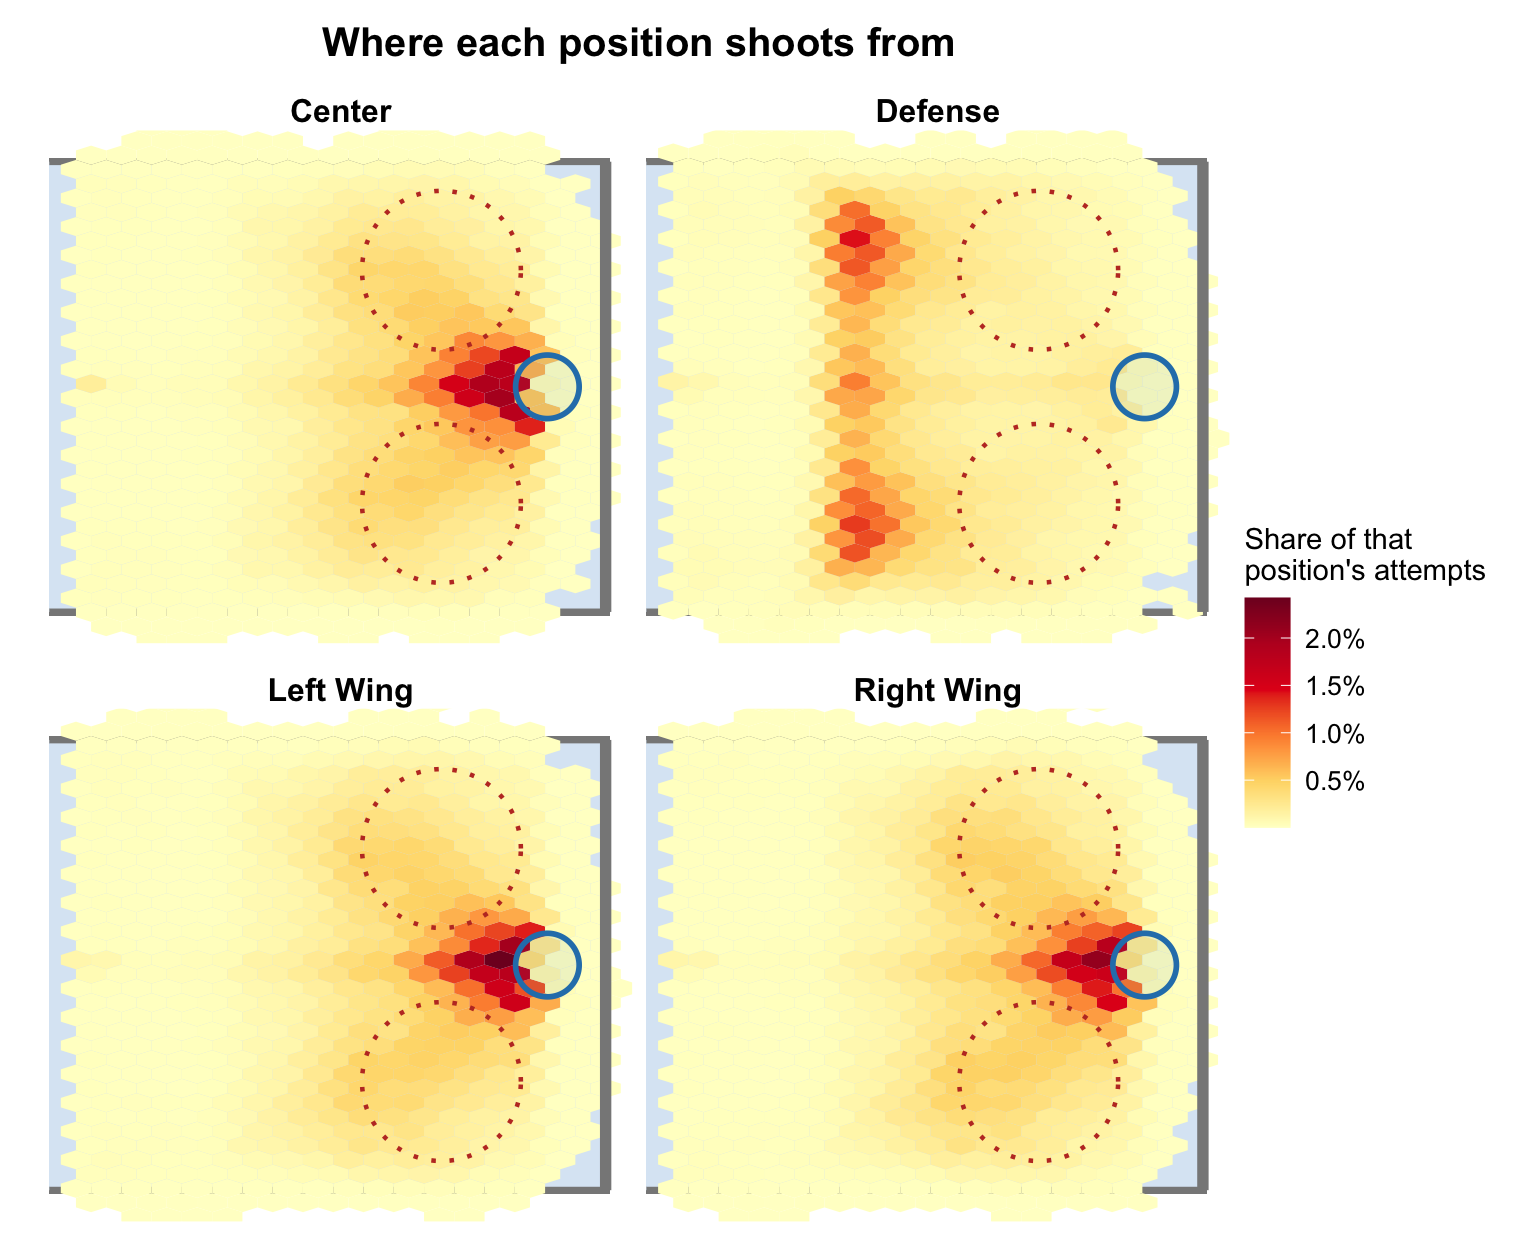
Each panel shows that position's own shot attempts as a share of its total, so the shapes are comparable across positions. Centers and both wings crowd the slot; defensemen load up at the point. The two wing maps are almost identical — forwards play one game, defensemen play another.
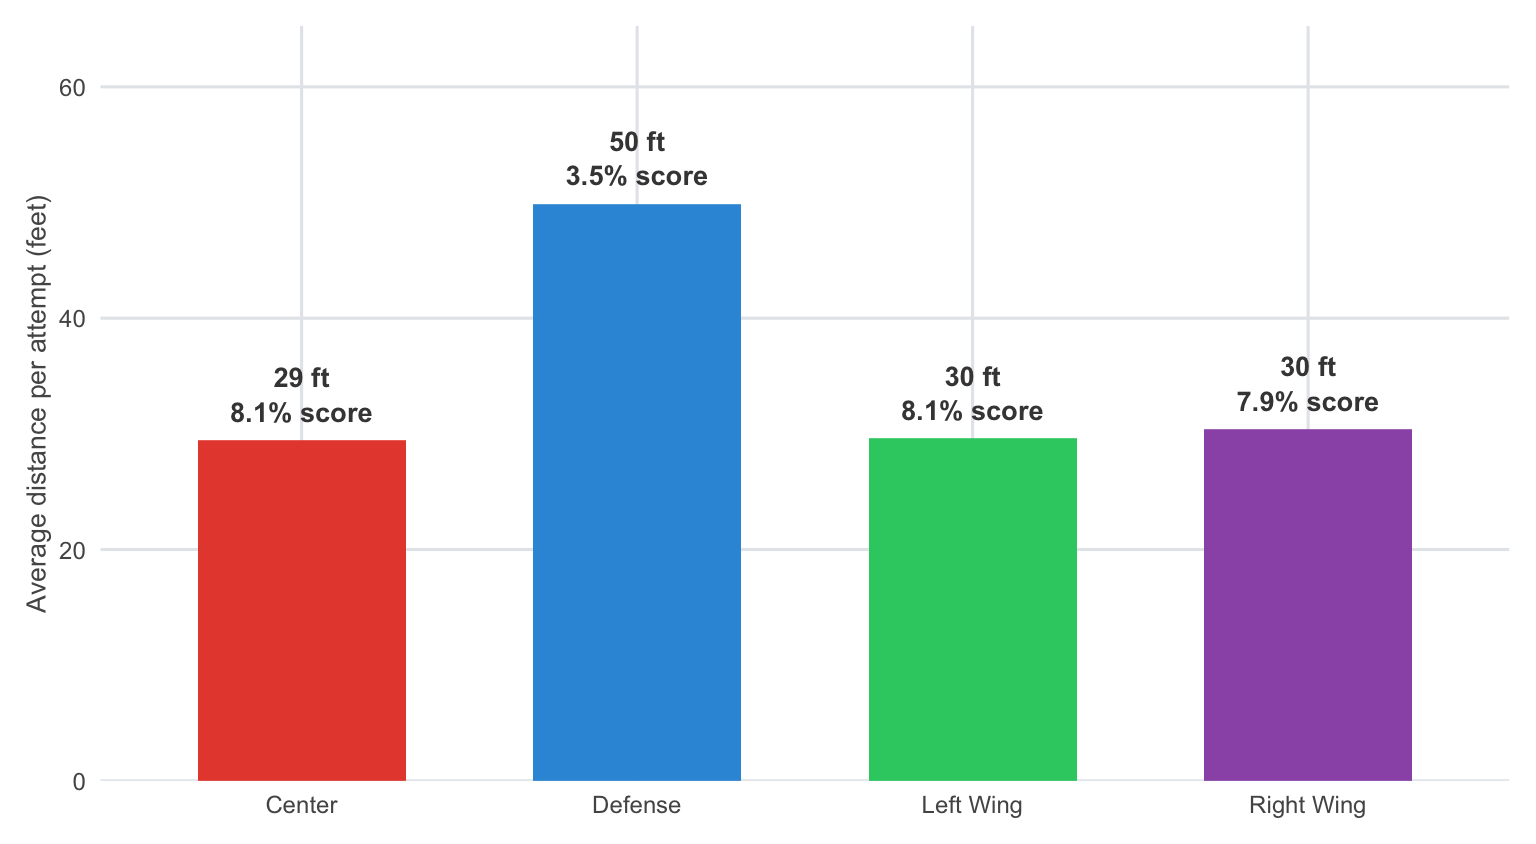
Average shot distance by position, with each position's scoring rate. Defensemen fire from roughly 20 feet farther out — and score on fewer than half as many of their attempts as forwards do.
Act III: The Goal Line
Not all shots are created equal. A blast from the blue line and a tap-in from the crease are both “shots” — but they don’t score at the same rate.
The data makes this brutally clear. Shot density spreads across the entire offensive zone — wide, diffuse, hopeful. Goal density collapses into a tight cluster right in front of the net. The gap between where shots come from and where goals happen is the gap between hope and results.
Distance kills scoring chances. From the blue line, hundreds of shots yield almost no goals. From the crease, almost every shot is dangerous. The ice has a geography, and the goalies know it — but the shooters do, too.
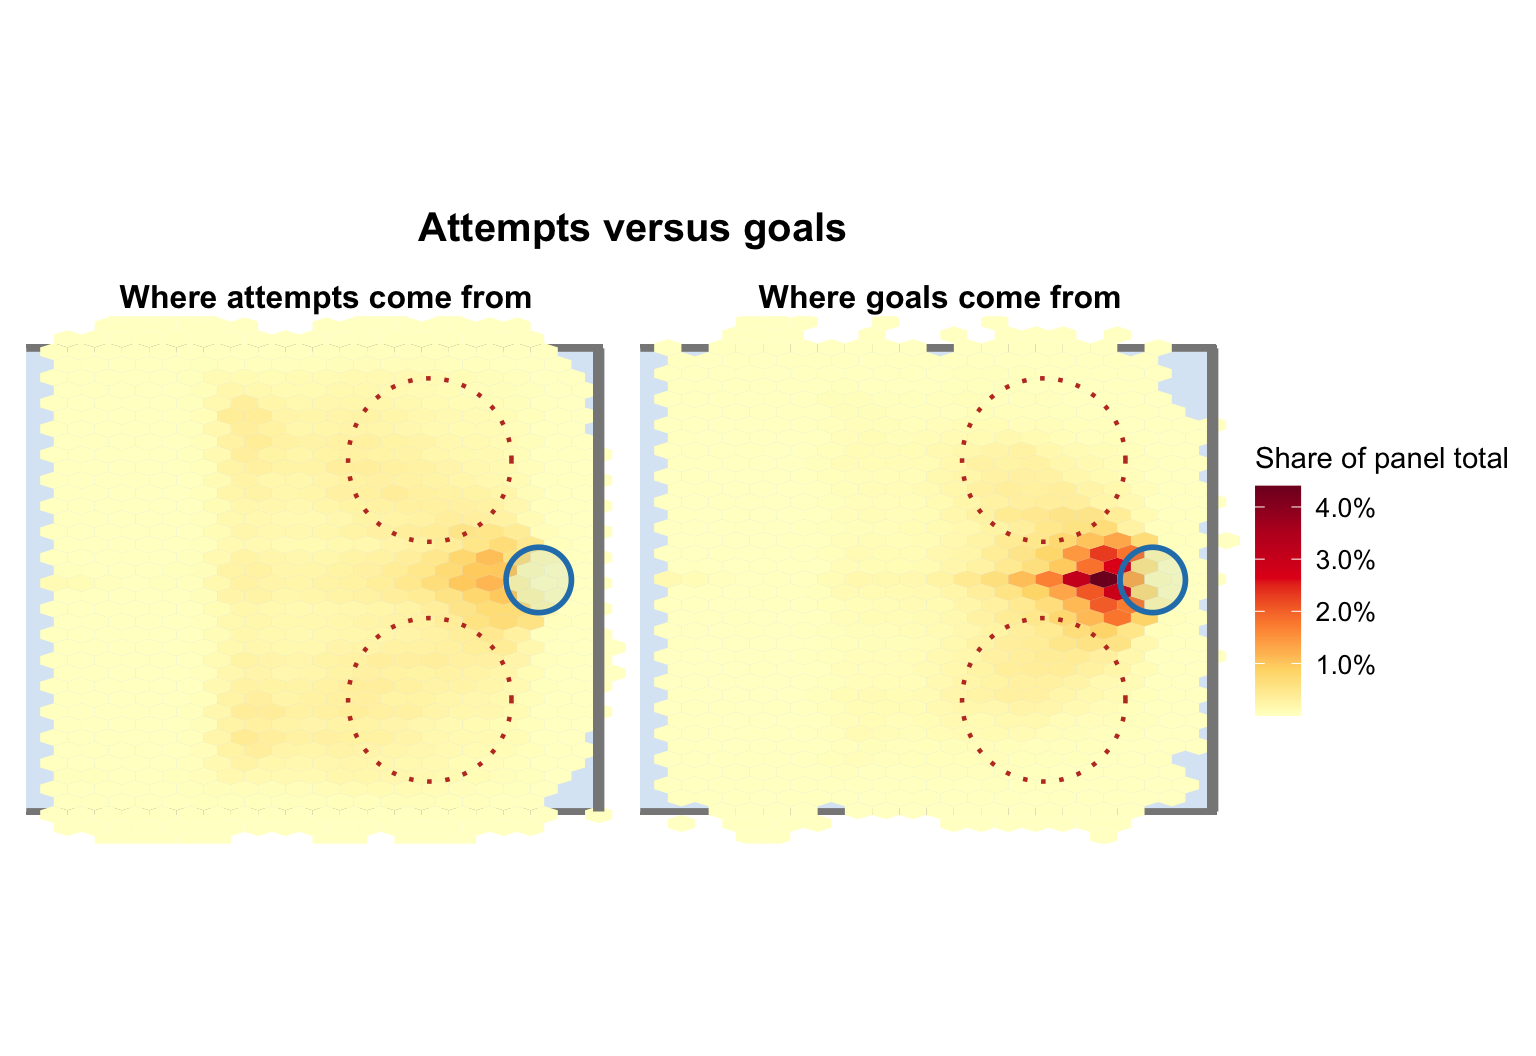
Left: every attempt as a share of all attempts. Right: every goal as a share of all goals — same color scale. Attempts smear across the whole zone; goals collapse into the slot. The slot holds 38.7% of attempts but 68.9% of goals.
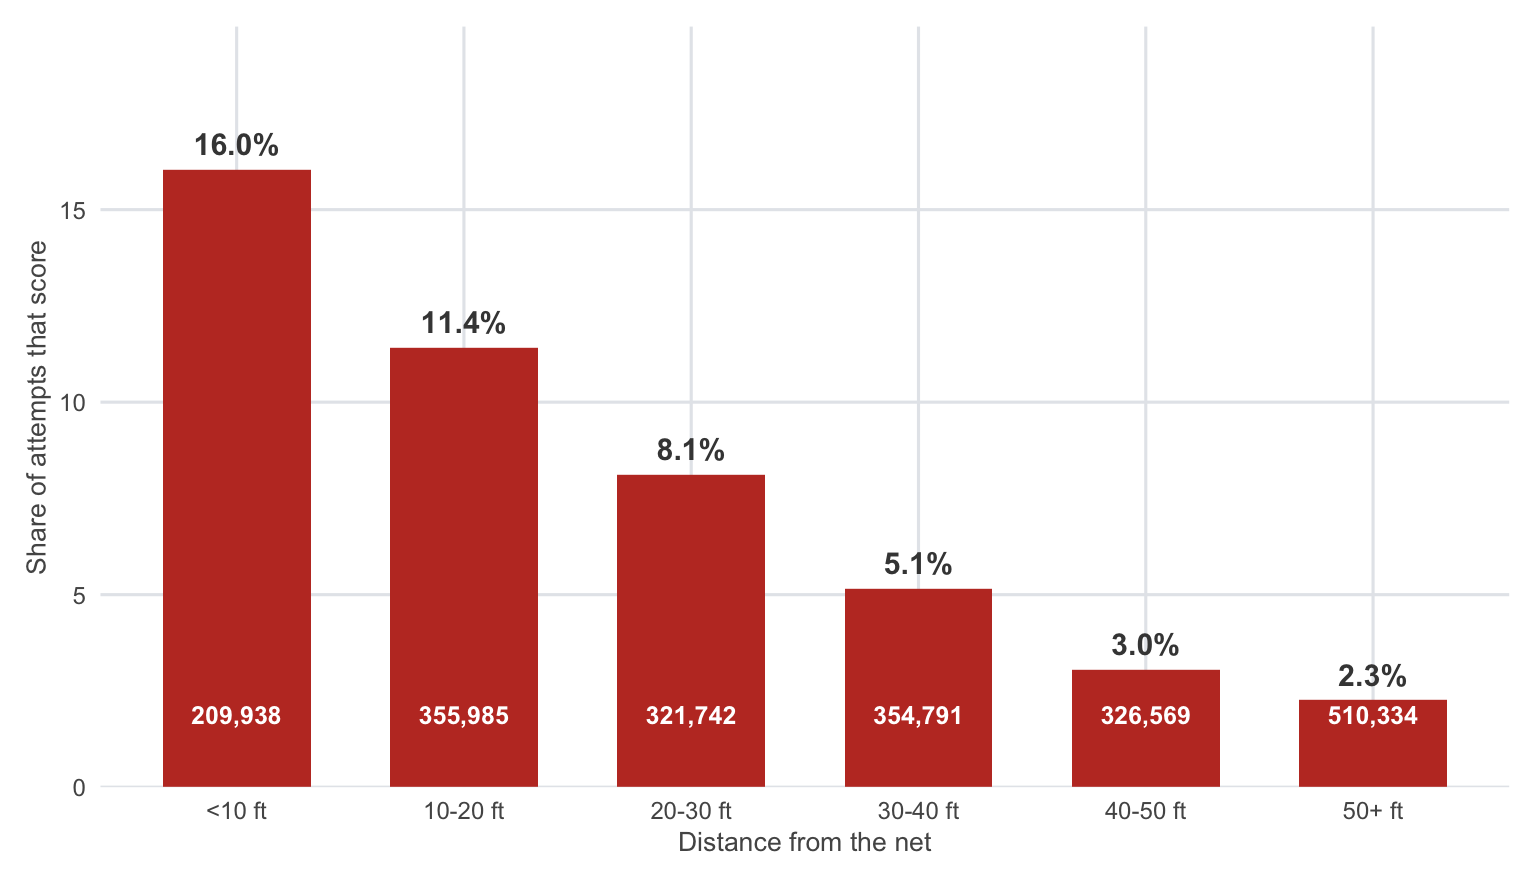
Scoring rate by shot distance across 19 seasons, with attempt counts inside each bar. Inside 10 feet, one in six attempts scores; from 50+ feet, it takes nearly 45 attempts for a goal.
The Takeaway
The NHL is a game of angles and inches. This data tells a clear story:
- The slot is king. The area between the faceoff circles is where games are won.
- Position dictates opportunity. Forwards camp in the slot and score on roughly 8% of their attempts. Defensemen create from a distance — 20 feet farther out, for about half the reward.
- Proximity = probability. Every foot closer to the net dramatically increases your chance of scoring.
The ice surface hasn’t changed in a century. But how teams use it — that’s the game within the game.
Ready to dig deeper?
Head to the Exploration page to filter by season, position, and more.
Shot data is sourced from MoneyPuck and covers all shot attempts (shots on goal, missed shots, and goals) from 2007-2025. Both ends of the rink are folded onto one attacking end, with the net at x = 89. Scoring rate = goals divided by attempts.